What are the most important GA4 metrics you should always keep an eye on? Understanding visitor behaviour is crucial If you run a website or operate a business online. But with the wide range of metrics Google Analytics 4 provides, it can be overwhelming to know which ones really matter.
For that reason, this article cuts through the noise to highlight the most vital Google Analytics 4 metrics every website owner should be tracking. While GA4 offers a treasure trove of data, a few key numbers will give you the big picture. We will explore the key metrics that show how people use your site so you can turn insights into action.
Monitoring these website health checkpoints provides the feedback you need to attract more traffic, boost engagement, and increase conversions over time. Let’s get started!
What is Google Analytics 4?
Google Analytics 4 (GA4) is the newest version of Google’s website analytics service. It tracks and reports on website traffic and other metrics to help understand online business performance.

GA4 is an upgrade from the original Google Analytics and was developed in response to changes in consumer behaviour and privacy laws.
But how does GA4 differ from the original Google Analytics?
- GA4 can track activity on both websites and mobile apps. The original Google Analytics was limited to websites.
- There is a completely redesigned dashboard in GA4.
- GA4 introduces new engagement metrics. These include engaged sessions, engagement rate and engagement time.
- GA4 uses predictive analytics that allows it to forecast metrics like purchase probability, churn probability and predicted revenue.
In summary, GA4 provides more advanced tracking compared to the original Google Analytics. It gives a more complete view of the customer journey across websites, apps and devices. The predictive analytics also allow you to forecast future performance and stay ahead of competition.
What are Metrics and Why Should You Track Them?
Metrics are the quantified measures that provide crucial insights into your website’s performance. In Google Analytics 4 (GA4), metrics give you the data you need to understand user behaviour, gauge marketing effectiveness and continually optimise the customer experience.
Simply put, Google Analytics metrics are the key performance indicators that tell the story of how your site is doing. Closely monitoring core metrics on a regular basis allows you to make smart, data-driven decisions to boost results over time.
Here is a breakdown of all the key metrics we will be covering.
1. Key Awareness Metrics:
- Users
- New Users
- Sessions
2. Key “Consideration” Metrics:
- Engaged Sessions
- Engagement Rate
- Average Engagement Time per Session
- Average Engagement Time
- Bounce Rate
3. Key “Purchase” Metrics
- Conversions
- User Conversion Rate
- Session Conversion Rate
4. Additional Mentions
- Event Count
- Audience Metrics
- Connecting 3rd Party Tools
Why Track Them?
But why should you track these metrics? Here are compelling reasons why we think it is vital to track Google Analytics 4 metrics:
- You will gain in-depth insights on user behaviour: Metrics like bounce rate, pages/session and average session duration provide unprecedented visibility into how visitors use and interact with your site. You can see where they enter, how they move through pages, content they engage with, and drop-off points. These behavioural insights allow you to optimise site design and user flows for engagement and conversions.
- Quickly identify issues and growth opportunities: When you track GA4 metrics, you pinpoint pain points like spikes in bounce rates on landing pages. These stats also illuminate emerging opportunities such as rising organic traffic from new keywords. With metrics, you clearly see what needs fixing and where hidden growth potential lies.
- You can set data-backed goals: Establish benchmark metrics to determine baseline performance across funnels. With that, you can then set measurable goals based on opportunity areas — be it boosting on-site engagement or increasing lead conversion rates. Thanks to such concrete goals in place, you can track progress and work towards hitting key performance targets.
- Determine marketing effectiveness and ROI: Tracking metrics allows you to thoroughly evaluate campaign attribution to see true return on investment from each marketing channel and initiative. You can easily identify the campaigns, ads and creatives driving the most valuable traffic and conversions. This in return allows you to double down on what works while eliminating wasteful spending.
- Guide design and content enhancements: Let the data direct where you focus efforts to improve conversion rates. For example, optimise high exit pages, expand on popular content categories or highlight key value propositions visitors are looking for.
- Continually optimise the entire customer experience: Evaluating GA metrics allows you to identify major drop-off points or friction across the buyer journey from initial visit to purchase and beyond. You will have the knowledge to streamline user flows, strengthen engagement and match content to needs at each stage. This goes a long way in creating a seamless path to conversion.
Key “Awareness” Metrics to Track
GA4 metrics give you a wide range of website data to track. To shed light on these key areas, we have categorised metrics based on their purpose: awareness metrics, consideration metrics, and purchase metrics. We will explore each category in turn to understand its value. Let’s start with the key awareness metrics, which indicate how much visibility your brand achieves across channels.
Users
The users metric shows the total number of unique individuals who have visited your website in a selected timeframe. Google Analytics identifies unique users by tracking anonymous ID cookies or logins associated with each visitor.
To view your total site users, go to “Reports” > “Life cycle” > “Acquisition” > “Overview.”
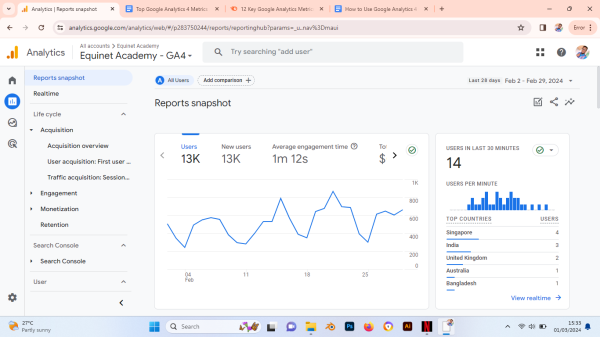
Picture 2: Users and New Users Metrics Report
Monitoring this overall trend shows whether you are attracting more users over time and therefore signaling growth. If you aren’t seeing a rise in monthly users, that likely indicates a need to revisit your marketing strategy and content to widen reach.
Getting visibility on your total audience reach provides helpful insight on the current market potential and by comparing changes over time. This allows you to spot upward or downward trends in your expanding or declining audience size. Keeping a pulse on site users highlights opportunities to capture more of your target audience moving forward.
New Users
The New Users metric shows how many first-time visitors come to your website during a specific period. Google Analytics identifies these new users by looking for visitor cookies or IDs that haven’t previously been recorded.
Tracking new users serves an important purpose — it helps gauge the effectiveness of your marketing and content at attracting net new audiences to your site. High new user numbers indicate your brand is resonating with fresh faces. This expands your reach beyond existing followers.
Comparing new users month-to-month highlights growth opportunities. For example, a sudden spike in new users may mean a recent social media campaign garnered new interest. Or a downward trend may signal it is time to enhance your content strategy to bring in audiences unfamiliar with your brand.
Monitoring this metric provides insight into how well you continually attract and engage brand new visitors over time. The goal is to bring in and retain new users, not just repeat traffic.
Sessions
The Sessions metric in GA tracks periods of engaged user activity on your site. GA4 has refined the functionality of this metric to attain more precision. Here is what changed from Universal Analytics:
- Each session generates a unique ID so every action the user performs can be fully linked and traced back to that specific session. They are now more traceable from start to finish.
- Sessions no longer timeout after 30 inactive minutes or automatically close out at midnight. Both could previously lead to undercounting active engagement spans.
- The updated approach provides a truer picture of user activity from start to finish within a session whether short or long-running.
Tracking sessions helps gauge engagement intensity beyond your overall visitor count. High or increasing sessions indicate visitors are finding content, products or services to actively interact with instead of just passing through. It also shows you are driving multi-page interest, exploration, consideration and conversions.
To see your website’s session activity, go to Reports > Lifecycle > Acquisition > Traffic Acquisition.
This view shows your total sessions and breaks it down by where visitors came from originally.
Look at which traffic sources are driving the most sessions. If organic search makes up a large portion, it means your SEO can be improved to increase visitor engagement from Google. If email contributes a lot of sessions, try enhancing your email marketing campaigns to boost subscriber click-throughs.
Analyzing sessions by source helps you double down on high-potential areas. The goal is to fuel further interest where you already see momentum taking shape based on the data. Identify sources sparking engagement and continue optimising them.
Key “Consideration” Metrics to Track
Now let us look at the key “consideration” metrics that you should keep a keen eye on in GA4.
Engaged Sessions
An engaged session means a visitor has a meaningful experience on your site rather than bouncing right back out. The key criteria for a session to count as “engaged” in Google Analytics 4 includes:
- Visitor session length extends beyond 10 seconds
- The visitor views 2 or more pages/screen
- They trigger a conversion goal like a signup
- Or they meet a combination like viewing another page and staying over 10 seconds
If a visitor only reads briefly and leaves in under 10 seconds without interacting further, that activity would not qualify the session as engaged.
Tracking engaged sessions helps you gauge your website’s ability to hold attention, spark exploration via pageviews, and drive desired conversion events. It sheds light on whether you deliver interesting value. Comparing the trend shows if you are improving experiences.
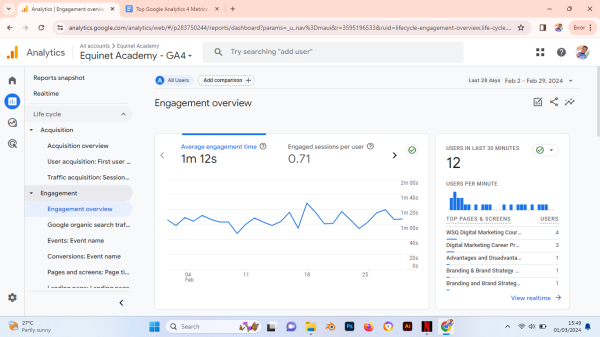
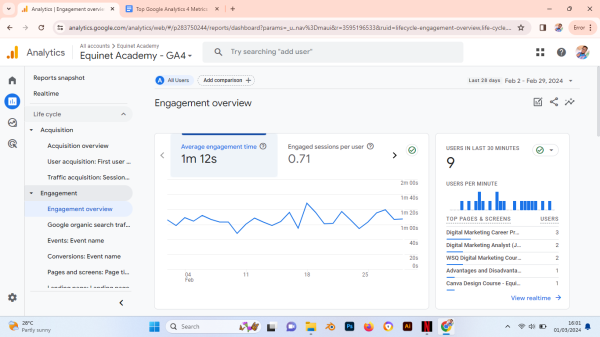
To see the “Engaged sessions”metric for your site, go to “Reports” > “Life cycle” > “Engagement” > “Overview.”
Engagement Rate
The engagement rate metric measures the percentage of sessions that showed meaningful visitor engagement out of total sessions tracked during a specific timeframe. It calculates what proportion of sessions went beyond brief bounces to have back-and-forth interactions with your content.
A high or rising engagement rate means more visitors are sticking around to actively click, read, browse products, play videos, fill out contact forms or whatever engagement looks like for your website – rather than just peeking at one thing briefly then leaving your site forever.
It paints a picture of whether you give visitors enough value to keep them around. And the trend shows whether you are getting better at hooking attention. Say you have 100 sessions and in 50 of them visitors explore pages, watch videos etc. – your engagement rate would be 50%.
By monitoring the engagement rate percentage alongside total site traffic metrics, you gain fuller context around your website’s ability to create active experiences and bonds with visitors.
Average Engagement Time per Session
The Average Engagement Time per Session metric shows how long visitors actively interact with your website pages or app screens per visit on average.
Google Analytics calculates it by taking the total sum of time visitors have content open and in focus, then divides that total engagement duration by the total sessions that occurred over that timeframe.
So if over in 100 sessions there were 2000 collective minutes visitors had your pages/screens open and engaging with them, the average time per session would be 2000/100 = 20 minutes.
The more absorbing and interactive your content is, the longer average engagement time should rise over baselines. Comparing the average engagement minutes per session week-over-week can reveal whether new content helps build stickier experiences.
Lengthy stretch-out focused spans show that your site delivers value. Shorter distracted spans are a sign that you should make design changes to captivate visitors start-to-finish.
Average Engagement Time
The Average Engagement Time metric reveals how long the average visitor actively interacts with your website pages per session. It specifically tracks timespans when your site is open and in browser focus – meaning the user has your page open in the active tab and they are demonstrably attentive to it.
For example, if a visitor opens an article and concentrates on reading it for 5 minutes, all 5 minutes count towards average engagement time. However, if they switch to browse Instagram for 10 minutes while your webpage sits ignored on another tab, that span would not get tallied. This makes Average Engagement Time a qualitative metric pinpointing truly attentive time-on-site.
To view it, go to GA Reports > Lifecycle > Engagement > Overview.
Lengthier average engagement is highly desirable because it means your content inspires committed focus rather than cursory skims. People devote longer average attention spans to websites delivering compulsive value aligned to their needs. If your site has lower engagement times, you should implement qualitative and quantitative enhancements to recapture visitor attention.
Tips for boosting users’ average engagement include:
- Ensure easy navigation and quick load speeds to eliminate distractions.
- Optimise readability via scannable formatting to encourage sustained reading.
- Incorporate absorbing visual assets like infographics and video to capture.
Monitoring this metric provides actionable, micro-level insights on your website’s ability to consume visitor focus over time. Leverage it to guide ongoing grab-them-and-keep-them website optimisations.
Bounce Rate
Bounce rate is defined as the percentage of website sessions that end up being non-engaged visits. A non-engaged, bounced session means the user exits your site in under 10 seconds after landing on an initial page. They don’t click or interact with anything else before leaving.
For example, say a visitor finds your site via a link, lands on your contact page, takes a quick 6-second skim, then immediately hits back without any other page views or form fills. That would count as one bounced visit.
To view bounce rates in Google Analytics 4, you will need to manually add it as a customised metric for any desired report. Here is how:
- Select your target GA4 report under Reports tab
- Click editor icon to access metric settings
- Under “Metrics” choose “Add Metric” > Bounce Rate > Apply
Now you will see what percentage of sessions across various segments like pages, sources etc. ended up bouncing.
Ideally, you want low bounce rates because it means visitors quickly find interesting info to keep them engaged. High bounce rates indicate failure to intrigue people to stay on your site longer and engage with it.
If high bounce rates occur, optimise sticky factors like:
- Testing appropriately catchy page visual designs
- Ensuring swift mobile and desktop site speeds
- Creating intuitive navigation bars and menus
- Improving readability via chunky formatting
- Feature relevant dynamic content prominently on key pages
Traditionally, bounce rate was calculated by taking all single-page sessions divided by total sessions. GA4 now specifically divides all non-engaged sessions where the visit lasted under 10 seconds by total sessions for a refined engagement-focused percentage.
So instead of just seeing what percentage of users only hit one page before leaving, you see what share of all visits lacked meaningful interactions – ranging from reading articles for over 10 seconds to triggering conversions across multiple pages.
This updated calculation provides a fuller snapshot not only accounting for depth but also attention and activity thresholds that suggest positive or negative visits.
Key “Purchase” Metrics to Track
The next phase of metrics to track are the “purchase” metrics. They are very important because they show the end product of a visitor’s time on your site. Here are the key purchase metrics to keep an eye on.
Conversions
Conversions represent user actions that hold significant business value for you. These could include email signups, product purchases, newsletter subscriptions, app downloads or any defined events that accomplish your online goals when users complete them.
In Google Analytics 4, you determine which user interactions qualify as conversion events. For example, if persuading visitors to sign up for demos is what you are looking for, you would designate submitting demo requests as a conversion activity in GA4. Then the platform tracks each incidence as a conversion.
To mark existing events as conversions in GA4:
- Click Configure > Events in the navigation sidebar
- Locate the event under Existing Events table
- Toggle “Mark as conversion” switch enabled
Monitoring your conversions provides tangible insights on real website successes and revenue achievement. If set optimally, high or rising conversions suggest your content and messaging effectively persuades visitors to take meaningful actions. Underperforming conversion rates indicate opportunities to refine landing pages, CTAs, funnels and messages to increase engagement.
Essentially, designating and optimising conversions allows you to quantify online effectiveness beyond simple site traffic. This will directly unlock your website’s business value.
User Conversion Rate
The User Conversion Rate shows the percentage of unique visitors who completed a conversion event out of your total users during a given timeframe.
It differs from overall conversion rate in that the focus is specifically on the proportion of converted users rather than sessions. Once an individual visitor triggers their first conversion, that user counts positively towards the rate going forward. Their user conversion rate holds at 100% whether they convert multiple times or never again.
Let’s walk through some scenarios:
Visitor A has 2 website sessions but never converts – Their personal conversion rate is 0%
Visitor B has 5 sessions and converts only on their 3rd visit – Their conversion rate still hits 100%
If Visitor A and Visitor B were your only 2 site users so far, your overall User Conversion Rate would be:
Total Users = 2
Converted Users = 1 (Visitor B)
Calculation = Converted Users / Total Users x 100
So User Conversion Rate = 1 / 2 x 100% = 50%
This illustrates how the overall rate balances single-time converters and repeat non-converting visitors. Monitoring changes monthly provides insight on your website’s ability to influence new users to become business transaction converters over time.
Session Conversion Rate
The Session Conversion Rate shows the percentage of total website sessions that resulted in a conversion event being completed during that session.
A conversion represents any predefined goal-oriented user action that carries significance for your business, such as product purchases, email list signups, content downloads, or contact form submissions.
The calculation divides the number of sessions containing a conversion by the total website sessions, then multiplies that fraction by 100 to convert it to a percentage.
For example, if you received 1,000 website sessions over a month and 250 of those sessions involved the user submitting an inquiry form (which you have defined as a conversion), then the calculation would be:
Session Conversion Rate = (250 conversion sessions / 1,000 total sessions) x 100 = 25%
By setting up conversion events within your Google Analytics 4 platform, you can automatically track session conversion rates associated with each type of action.
Here is how to set this up;
- Under Configure, create an Event for each desired conversion
- Under Reports, add your events individually as metrics
- View conversion rates by acquisition channel, page, referrer etc.
Assessing session conversion trends helps gauge the effectiveness of marketing campaigns, on-site messaging, calls-to-action and more in successfully prompting visitors to convert during their visit. Target underperforming elements to perpetually increase this rate.
Additional Mentions
Up to this point, we have covered crucial metrics that you must track to get the most out of your website. However, there are other notable mentions that we also believe are vital. They are;
Event Count
The Event Count metric replaces Goal Completions from old Google Analytics versions. It tallies the total times users trigger defined events on your website over a given timeframe.
Possible event examples across industries include:
- New lead form submissions
- Content downloads
- Video plays
- Chatbot interactions
- Product purchases
Essentially, any website activity you want quantified falls under trackable GA4 events. This allows granular tracking of micro-conversions that might otherwise seem invisible without event tracking.
Monitoring event counts over time provides visibility into which interactions users complete most often when engaging with your brand. Seeing trend spikes may indicate positive response to new feature releases or campaigns driving specific on-site behaviours.
Audience Metrics: Location & Device Category
Google Analytics 4 allows comprehensive analysis of audience segments based on attributes like location and device type. Under the Audiences section, you will find pre-made templates for convenient analysis. However, customization unlocks more targeted insights.
To configure a tailored audience:
- Go to Audiences and select “+New Audience”
- Name audience then click “Custom”
- Select “Demographics” and enable “Location”
You can now view users segmented by country, city, metro area and more.
Additionally, you can also use the “Technology” segment to enable device category filtering. This gives you access to analysis that can isolate mobile, desktop, tablet and other device groups.
With audiences, you have a few preset templates to choose from:
- Demographics: Compare engagement metrics for your top user countries. Identify hot spots and expand localisation there if higher purchasing activity occurs.
- Technology: If lower conversion rates occur on mobiles versus tablets, assess usability pain points forcing early exits. Or limit promotions if engagement stats skew higher on tablets.
Essentially, custom audience reporting allows creating focused segments matching your goals. Monitor groups over time and run experiments or change targeting based on trends. This achieves better personalization for in-market user needs.
Connecting 3rd Party Tools: Search Console & Google Ads
Linking Google Analytics 4 and Google Search Console provides invaluable unified reporting on your website’s organic search visibility and associated user behavior.
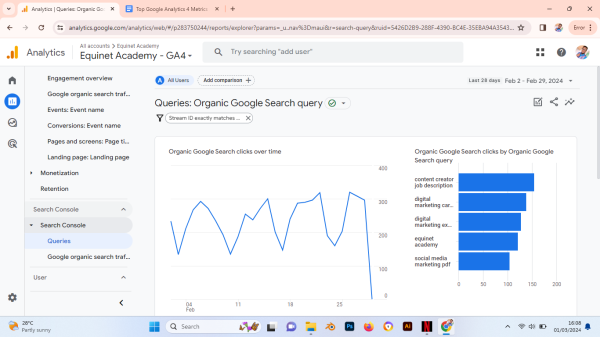
When integrated, two enhanced reports become available in your GA4 interface:
- Google Organic Search Queries: Shows which specific keywords and phrases trigger clicks from Google organic listings to your site including click and impression volumes. Use this metric to identify high impression queries with low click rate.
- Google Organic Search Traffic: Displays top landing pages receiving organic clicks, along with visitor metrics like locations and conversion actions per page. Spot underperforming pages failing to engage search visitors.
To enable integration and enhanced reporting:
- Within GA4 interface, click Admin > Data Streams
- Beside desired property, click Manage Google Ads & Search Console links
- Link your Search Console account
Powerful connected insights lead to organic efficiency. See which pages and keywords drive conversions or bounce rates implying SEO strengths versus weaknesses. Trends also inform Search Console link-building priorities and bidding strategies in Google Ads.
Calculated Metrics
Calculated Metrics are custom GA4 metrics you create using formulas with existing metrics. This lets you measure things not tracked out-of-the-box.
For example, say you want to see revenue generated per website session. GA4 doesn’t show this directly, but you can calculate it:
Total Revenue / Total Sessions = Revenue per Session
The example-derived metric tells how much money is made per visit.
Here is how to set up your own calculated metric:
- Go to Admin > Custom Definitions > Calculated Metrics tab
- Click + Create Calculated Metric
- Give it a name and description
- Enter formula using current metrics/dimensions wrapped in {curly brackets}
- Save it
Now you can add your tailored metric to any report. The formula computes it “on the fly” based on fresh data. This gives you ultimate flexibility to derive metrics that reveal anything meaningful to you – just get creative with the math formulas!
Wrapping It Up
This article covers just a fraction of the many valuable Google Analytics metrics available. By tracking this handful of key metrics on your website, you’ll gain tremendous insights on opportunities to improve.
To truly master digital analytics and all its capabilities, we highly recommend you enroll in our Digital Marketing Analytics Course. Our expert instructor teaches everything you need to optimise your Google Analytics tracking across a 2-day intensive course. Attendees gain hands-on experience and advanced strategies to thrive with analytics. You will be fully equipped to drive website success thanks to certified digital strategies.
Space is limited – claim your seat today to achieve expert-level analytics prowess, propelling substantial online growth!
Dhawal is the Managing Director at 2Stallions Digital Marketing Agency, an award-winning full-service digital marketing agency, based out of Singapore that he co-founded in 2012. It has grown from a founding team of 2 to a team of 20, and growing, across 4 countries. He has overseen more than 250 successful digital marketing projects with clients ranging from startups to MNCs.